THE COLD CHAIN SOLUTIONS NEWSLETTER
THE COLD FRONT, ISSUE 7
Frozen and Refrigerated Cold Chain Insights
Welcome to the seventh issue of The Cold Front, presented by RLS Logistics. We proudly offer nationwide cold storage warehousing, less than truckload shipping, truckload transportation and eCommerce fulfillment cold chain solutions. As cold chain experts in frozen and refrigerated logistics, we are focusing on these topics for our April 2021 issue: labor shortage, truck demand, diesel fuel, and hot markets in the cold chain. The Cold Front is a monthly summary highlighting pertinent cold chain market data in one concise location. These insights ensure that you have the data you need to make better decisions to fuel your growth. We hope you find this information useful! If you would like data on your specific market, click the button below.
The Labor Shortage
Sure the driver shortage has been a topic for many years, but now we are faced with a general labor shortage that is impacting the supply chain at the warehouse level. Chris Spear, president, and CEO of the American Trucking Associations, recently spoke out about how the industry needs to hire 1 million truck drivers to maintain the economy’s demand. According to a LinkedIn report, warehouse workers on the front lines of e-commerce are in high demand. Hiring for these roles grew 73% year over year. According to the Motley Fool, Amazon hired approximately 500,000 new employees last year and is expected to hire another 75,000 employees in 2021. In addition, the Federal Government’s American Rescue Plan has potentially removed labor out of the market by providing additional unemployment benefit payouts and is expected to last until September.

The U.S. jobs report for April reported a bleak 266,000 jobs added, falling well below what economists expected. Many questions are circling the topic, and at this point, we are hoping for a miracle solution to get everyone back to work. So what does this mean for shippers? We expect tight capacity will continue to fuel demand for trucks, and companies will look for ways to incentivize warehouse positions, in most cases, increasing wages to attract employees. Both factors will lead to increased transportation costs until more capacity enters the market and labor woes are corrected.
Truck Demand
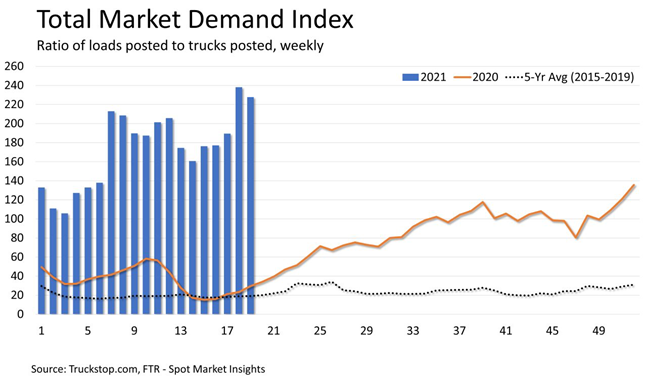
The below graph says it all. According to Truckstop.com’s Spot Market Insights, the ratio of loads posted to trucks posted is significantly higher in 2021 versus last year and the 5-year average. In week 19, there were approximately 225 posted loads versus about 30 this time last year. Finding and securing capacity in this market is one of the most significant challenges brokers and shippers face, and it costs them a lot more. According to the DAT, the average cost per mile for refrigerated transport in the truckload spot market so far in May is $3.09, up about 20% since February and the highest price on record.
Diesel Fuel
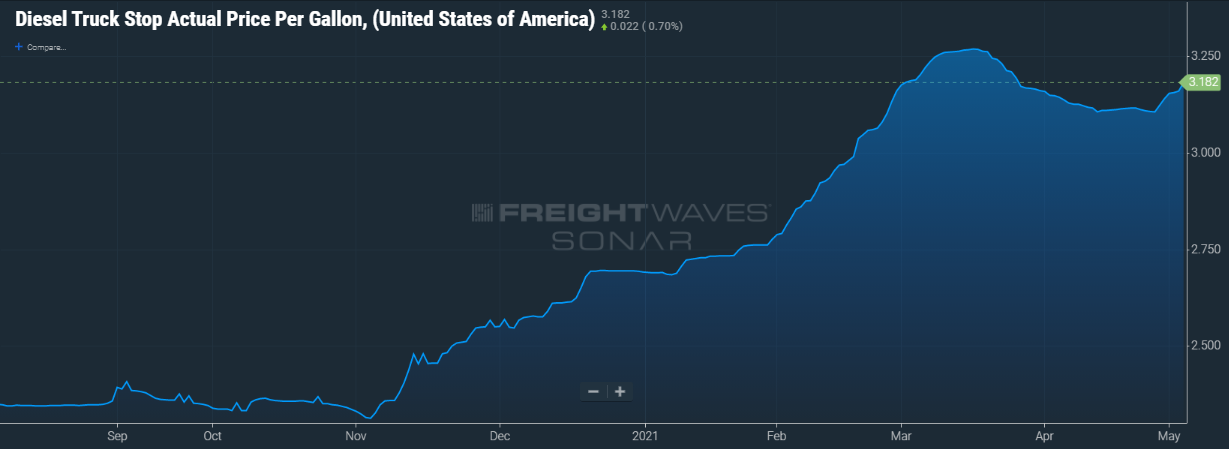
On May 17th, the Department of Energy reported the national average diesel fuel price at $3.249 per gallon. This was the highest national average since November 2018 and is 36% higher than it was this time last year. The fallout from the Colonial Pipeline shutdown is straining capacity for truckers delivering diesel to fuel stops. Carriers in the southeast were clamoring for fuel to keep their fleets moving. Some truck stops in the area experienced fuel outages and were encouraging people not to hoard the fuel. Additionally, some truck stops placed a limit on the amount of fuel truckers could purchase. As if shippers did not have enough challenges dealing with capacity, truckers reported either rejecting tenders or charging a premium rate for freight destined to those markets. The Colonial Pipeline has reported normal operations have resumed; however, it will take time to work the delays through the system. The price of diesel will be monitored closely as travel is expected to soar this Memorial Day.
Hot Markets in the Cold Chain
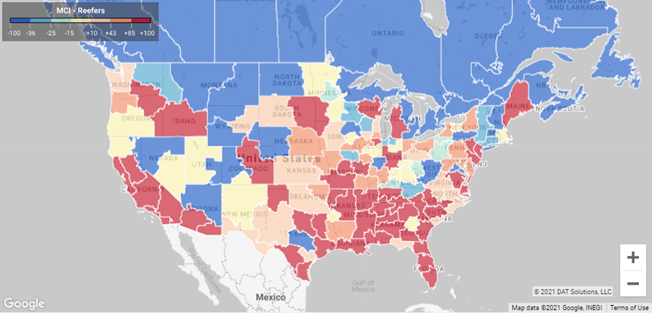
Produce is heating up for reefers in the Southeast, South Central, and Southern California areas, as indicated by the red shaded areas in the map below. Freight moving into these markets should be more attractive to reefer carriers, should you have the capacity. Freight moving out of these areas are demanding higher prices due to high demand. Blue areas signify looser capacity, while red and orange suggest a high load to truck ratio.


